
The Blockchain Never Stops Talking
Traditional financial markets often leave investors searching for clues hidden behind delayed reports, quarterly filings, or incomplete market disclosures. Large institutional positions may remain invisible for weeks, while significant capital movements frequently become public only after the market has already reacted. In many cases, retail investors are forced to make decisions using fragmented information, placing them at a considerable disadvantage compared to institutional participants with access to proprietary data.
Blockchain fundamentally changes this dynamic.
Every transaction, wallet interaction, smart contract execution, token transfer, and liquidity movement is permanently recorded on a public ledger. Unlike traditional markets, where much of the underlying activity remains hidden behind intermediaries, blockchain creates an unprecedented level of transparency. The challenge is no longer obtaining data—it is understanding what that data actually means.
Modern on-chain analytics transforms billions of blockchain records into meaningful market intelligence. Instead of reacting solely to price movements, investors can observe how capital flows through decentralized ecosystems, identify behavioral shifts among large holders, monitor exchange activity, evaluate network health, and detect trends long before they become visible on price charts.
In today’s digital asset markets, price tells you what has happened. On-chain data often explains why it happened—and, in some cases, what may happen next.
Why Price Alone Is No Longer Enough
For decades, financial analysis revolved around historical prices, trading volume, and technical indicators. While these metrics remain important, they represent only the final outcome of countless decisions made by market participants.
Blockchain introduces an entirely new analytical dimension.
Instead of observing only the result, investors can examine the underlying behavior that produces market movements.
Questions that once seemed impossible to answer now become measurable.
Are long-term holders accumulating?
Are institutional wallets increasing exposure?
Is liquidity leaving exchanges?
Are whales transferring assets to cold storage?
Is capital flowing into decentralized finance?
Are users actively interacting with a protocol?
Each of these signals contributes valuable context that traditional market analysis simply cannot provide.

What Is On-Chain Analytics?
On-chain analytics refers to the systematic analysis of blockchain transaction data in order to understand network activity, investor behavior, and capital movement.
Every blockchain records enormous quantities of publicly accessible information, including:
wallet balances;
transaction history;
staking participation;
token transfers;
smart contract interactions;
NFT activity;
bridge transactions;
validator behavior;
DeFi liquidity.
Specialized analytical platforms aggregate, organize, and interpret these datasets, transforming raw blockchain records into practical indicators that investors can use when evaluating market conditions.
Rather than replacing technical analysis, on-chain analytics expands it.
Following Whale Activity
Among the most closely monitored blockchain metrics is whale behavior.
Whales—wallets holding exceptionally large quantities of cryptocurrency—possess the ability to influence liquidity and market sentiment through significant transactions.
Monitoring whale activity allows investors to identify patterns such as:
large accumulation during market weakness;
substantial transfers to exchanges before major selling events;
withdrawals from exchanges into long-term storage;
portfolio diversification across blockchain ecosystems.
It is important to recognize that not every large transaction represents imminent buying or selling pressure.
Funds may simply be moving between institutional custody solutions, internal exchange wallets, or decentralized protocols.
Context remains essential.
Nevertheless, consistent monitoring of whale activity often provides valuable insight into broader market positioning.
Exchange Flows Reveal Investor Intent
One of the most powerful categories of on-chain indicators involves exchange inflows and outflows.
Exchange Inflows
When large quantities of cryptocurrency move onto centralized exchanges, investors frequently interpret the activity as a potential increase in selling pressure.
Although not every deposit results in immediate liquidation, elevated inflows often coincide with periods of increased market uncertainty.
Exchange Outflows
Conversely, substantial withdrawals from exchanges frequently indicate long-term holding behavior.
Investors transferring assets into self-custody generally demonstrate reduced short-term selling intentions.
Sustained exchange outflows may therefore contribute to decreasing available market supply.
When analyzed over extended periods, these trends help investors evaluate evolving market sentiment beyond simple price action.
Token Burning and Supply Dynamics
Supply plays a fundamental role in every financial market.
Blockchain introduces remarkable transparency into supply management through token burning mechanisms.
Token burning permanently removes assets from circulation by sending them to inaccessible blockchain addresses.
Investors monitor burning activity because it influences several important factors:
circulating supply;
inflation rate;
long-term scarcity;
tokenomics sustainability.
However, burn events should never be evaluated independently.
Meaningful analysis considers:
network adoption;
transaction demand;
protocol revenue;
overall ecosystem growth.
A declining supply without increasing utility rarely produces sustainable value.
Active Addresses Measure Real Network Usage
Speculation may temporarily drive asset prices, but long-term blockchain success depends upon actual adoption.
One of the simplest yet most informative indicators involves active wallet addresses.
Increasing activity generally suggests:
growing user engagement;
rising transaction demand;
expanding ecosystem participation;
healthy protocol utilization.
Declining activity, by contrast, may indicate slowing adoption or reduced network relevance.
While active address metrics cannot fully capture user quality, they often provide useful signals regarding the overall health of blockchain ecosystems.
Networks attracting consistent user growth frequently demonstrate stronger long-term resilience.
Total Value Locked (TVL) Reflects Capital Confidence
Within decentralized finance, Total Value Locked (TVL) has become one of the most widely monitored indicators.
TVL measures the amount of capital currently deposited across decentralized applications including:
lending platforms;
liquidity pools;
staking protocols;
derivatives platforms;
yield aggregators.
Increasing TVL often reflects growing investor confidence and expanding ecosystem participation.
However, interpreting TVL requires nuance.
Higher token prices naturally increase TVL even without additional capital entering the protocol.
Similarly, temporary incentive programs may attract liquidity that quickly disappears once rewards decline.
Professional investors therefore evaluate TVL alongside user activity, protocol revenue, and long-term retention metrics.
Stablecoin Flows Signal Market Liquidity
Stablecoins occupy a unique position within cryptocurrency markets because they frequently represent deployable purchasing power.
Monitoring stablecoin movements reveals valuable information regarding capital availability.
Large stablecoin inflows onto exchanges may indicate investors preparing to purchase digital assets.
Conversely, declining stablecoin balances may reflect reduced market participation or capital leaving cryptocurrency ecosystems entirely.
Institutional investors increasingly monitor stablecoin issuance alongside exchange reserves because these indicators often precede broader liquidity shifts.
In many cases, stablecoin activity provides earlier signals than price charts alone.
Smart Money Leaves Footprints
Institutional investors rarely announce portfolio decisions before executing them.
Blockchain nevertheless records their activity.
Sophisticated analytical tools increasingly classify wallet behavior according to historical patterns.
Long-term accumulators.
Professional trading firms.
Early protocol participants.
Liquidity providers.
Venture investors.
Governance participants.
Although blockchain addresses remain pseudonymous, behavioral analysis often identifies recurring investment styles that provide valuable market insight.
Following experienced participants does not guarantee profitable outcomes.
However, understanding where sophisticated capital is moving frequently improves strategic awareness.
Combining On-Chain Data With Technical Analysis
One of the most common mistakes among newer investors is relying exclusively on a single analytical framework.
Technical analysis explains price behavior.
Fundamental analysis evaluates project quality.
On-chain analytics reveals investor behavior.
Macroeconomic analysis provides broader financial context.
The strongest investment decisions typically emerge from combining all four perspectives.
Imagine the following scenario:
Technical analysis identifies a major support level.
Exchange outflows increase significantly.
Whale accumulation accelerates.
Stablecoin balances rise.
Developer activity remains strong.
Individually, each metric provides useful information.
Together, they create a far more compelling investment narrative.
Professional investors rarely depend upon isolated indicators.
Building Smarter Decisions With Integrated Analytics
The growing complexity of blockchain ecosystems makes manual analysis increasingly difficult. Monitoring multiple networks, exchanges, wallets, liquidity pools, and protocol metrics simultaneously requires sophisticated infrastructure capable of transforming raw blockchain data into actionable intelligence.
Modern Web3 platforms are addressing this challenge through integrated analytics dashboards that combine real-time on-chain metrics, portfolio monitoring, market intelligence, and risk assessment within a single interface. Instead of switching between multiple explorers and analytical tools, investors gain immediate visibility into whale movements, exchange flows, token distribution, liquidity changes, and network activity.
Advanced dashboards also incorporate customizable alerts, historical trend analysis, predictive indicators, and portfolio-level insights, enabling investors to respond more quickly to significant market developments. By consolidating fragmented blockchain information into a unified decision-making environment, these platforms help both retail and institutional participants navigate increasingly complex digital asset markets with greater confidence and efficiency.
The Future of Blockchain Intelligence
As artificial intelligence continues integrating with blockchain analytics, the next generation of market intelligence will become significantly more powerful.
Future analytical platforms are expected to:
identify hidden correlations automatically;
predict liquidity migration across ecosystems;
detect abnormal wallet behavior in real time;
evaluate governance risk;
forecast protocol adoption;
monitor institutional capital allocation continuously.
Instead of merely displaying blockchain information, intelligent systems will increasingly interpret it, prioritize relevant signals, and deliver actionable insights tailored to each investor’s portfolio.
Blockchain transparency already provides an extraordinary foundation.
Artificial intelligence will make that transparency dramatically more useful.
Conclusion
The cryptocurrency market has entered an era where information itself has become one of the most valuable assets. Blockchain technology offers an unprecedented level of transparency, allowing investors to observe capital flows, wallet behavior, network activity, and liquidity dynamics that remain invisible in traditional financial markets.
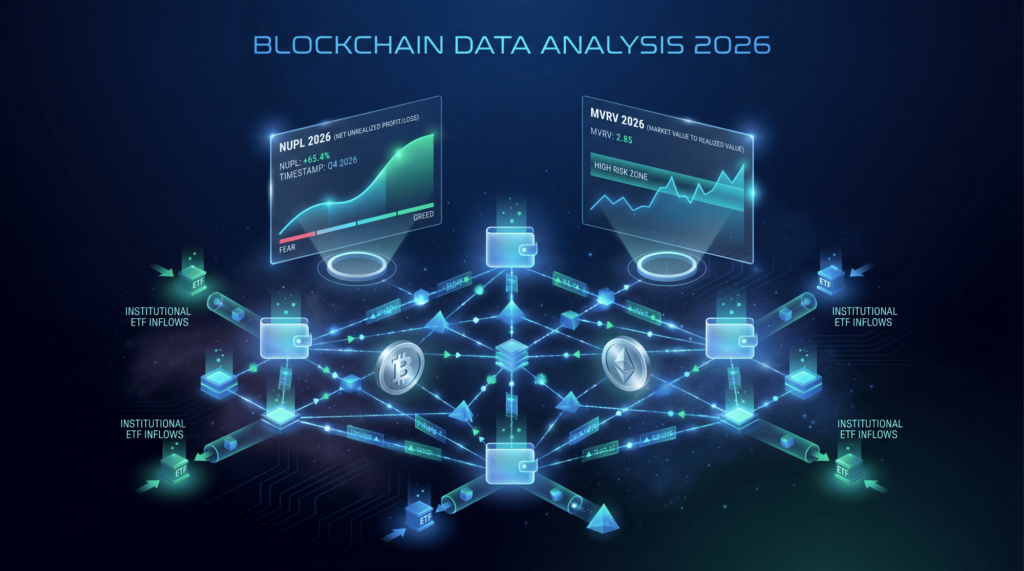
On-chain analytics transforms this enormous volume of public data into meaningful intelligence. By tracking whale activity, exchange inflows and outflows, token burning, stablecoin movements, active addresses, and Total Value Locked, investors gain a deeper understanding of market structure than price charts alone can provide.
No single metric can predict the future with certainty. However, when on-chain analysis is combined with technical indicators, fundamental research, and disciplined risk management, it creates a far more comprehensive framework for investment decision-making.
In an increasingly competitive digital asset market, success belongs not simply to those who react the fastest, but to those who understand the deepest layers of information. Blockchain leaves a permanent record of every transaction. The real advantage lies in knowing how to read the story those transactions are telling before the rest of the market catches up.